mayaviのTvtkの例
TVTKオブジェクトを構築し,Mayaviシーンに追加する純粋なTVTKプログラミングの例です.
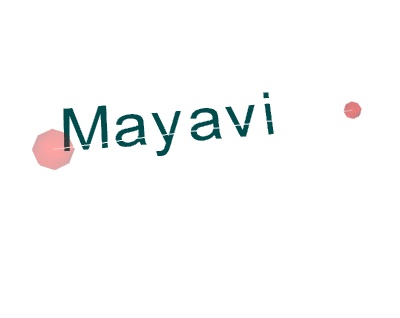
この例では,純粋なTVTKオブジェクトをMayaviシーンに追加する方法を示します.
このプログラミングスタイルでは,Mayavi(パイプライン,データ指向のmlab関数)のデータ管理機能を活用することはできませんが,VTKコードをMayaviまたはmlabコードと一緒に簡単に再利用することができます.
Mayaviでarbritrary VTKフィルタを使用する場合は,任意のVTKフィルタをMayaviパイプラインに挿入できるUserDefined Mayaviフィルタを使用することをお勧めします.たとえば,UserDefinedフィルタの例については, Mriの例 を参照してください.Mayaviを使用して構築された複雑なVTKパイプラインの完全な例については, Tvtkセグメンテーションの例 を参照してください.
Pythonソースコード: tvtk_in_mayavi.py
# Author: Gael Varoquaux <gael.varoquaux@normalesup.org>
# Copyright (c) 2008, Enthought, Inc.
# License: BSD Style.

from mayavi import mlab

# To access any VTK object, we use 'tvtk', which is a Python wrapping of
# VTK replacing C++ setters and getters by Python properties and
# converting numpy arrays to VTK arrays when setting data.
from tvtk.api import tvtk
from tvtk.common import configure_input_data

v = mlab.figure()

# Create a first sphere
# The source generates data points
sphere = tvtk.SphereSource(center=(0, 0, 0), radius=0.5)
# The mapper converts them into position in, 3D with optionally color (if
# scalar information is available).
sphere_mapper = tvtk.PolyDataMapper()
configure_input_data(sphere_mapper, sphere.output)
sphere.update()

# The Property will give the parameters of the material.
p = tvtk.Property(opacity=0.2, color=(1, 0, 0))
# The actor is the actually object in the scene.
sphere_actor = tvtk.Actor(mapper=sphere_mapper, property=p)
v.scene.add_actor(sphere_actor)

# Create a second sphere
sphere2 = tvtk.SphereSource(center=(7, 0, 1), radius=0.2)
sphere_mapper2 = tvtk.PolyDataMapper()
configure_input_data(sphere_mapper2, sphere2.output)
sphere2.update()
p = tvtk.Property(opacity=0.3, color=(1, 0, 0))
sphere_actor2 = tvtk.Actor(mapper=sphere_mapper2, property=p)
v.scene.add_actor(sphere_actor2)

# Create a line between the two spheres
line = tvtk.LineSource(point1=(0, 0, 0), point2=(7, 0, 1))
line_mapper = tvtk.PolyDataMapper()
configure_input_data(line_mapper, line.output)
line.update()
line_actor = tvtk.Actor(mapper=line_mapper)
v.scene.add_actor(line_actor)

# And display text
vtext = tvtk.VectorText()
vtext.text = 'Mayavi'
text_mapper = tvtk.PolyDataMapper()
configure_input_data(text_mapper, vtext.get_output())
vtext.update()
p2 = tvtk.Property(color=(0, 0.3, 0.3))
text_actor = tvtk.Follower(mapper=text_mapper, property=p2)
text_actor.position = (0, 0, 0)
v.scene.add_actor(text_actor)

# Choose a view angle, and display the figure
mlab.view(85, -17, 15, [3.5, -0.3, -0.8])
mlab.show()