単純な構造化グリッドの例
TVTKを使ってnumpy配列から構造化グリッド・データ・セットを作成し,mlabを使って可視化する例です.
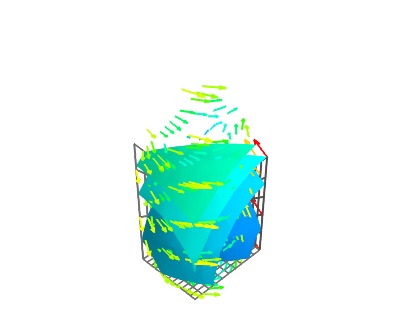
この例では,構造化グリッドデータセットを作成します.構造化グリッド,つまり各頂点が6つの隣接するグリッド上にある,スカラーとベクトルの両方のデータを記述します.このためには,mlabを使用するのではなく,StructuredGrid tvtkオブジェクトを直接作成します.より多くの制御を提供するパイプラインソース関数.
得られたデータセットを視覚化するために, mlab.pipeline インタフェース( mlab を使用したパイプラインの組み立て 参照)を使っていくつかのモジュールを適用します.
Pythonソースコード: simple_structured_grid.py
# Author: Prabhu Ramachandran <prabhu@aero.iitb.ac.in>
# Copyright (c) 2008, Prabhu Ramachandran.
# License: BSD Style.

from numpy import mgrid, empty, sin, pi
from tvtk.api import tvtk
from mayavi import mlab

# Generate some points.
x, y, z = mgrid[1:6:11j, 0:4:13j, 0:3:6j]
base = x[..., 0] + y[..., 0]
# Some interesting z values.
for i in range(z.shape[2]):
    z[..., i] = base * 0.25 * i

# The actual points.
pts = empty(z.shape + (3,), dtype=float)
pts[..., 0] = x
pts[..., 1] = y
pts[..., 2] = z

# Simple scalars.
scalars = x * x + y * y + z * z
# Some vectors
vectors = empty(z.shape + (3,), dtype=float)
vectors[..., 0] = (4 - y * 2)
vectors[..., 1] = (x * 3 - 12)
vectors[..., 2] = sin(z * pi)

# We reorder the points, scalars and vectors so this is as per VTK's
# requirement of x first, y next and z last.
pts = pts.transpose(2, 1, 0, 3).copy()
pts.shape = pts.size / 3, 3
scalars = scalars.T.copy()
vectors = vectors.transpose(2, 1, 0, 3).copy()
vectors.shape = vectors.size / 3, 3

# Create the dataset.
sg = tvtk.StructuredGrid(dimensions=x.shape, points=pts)
sg.point_data.scalars = scalars.ravel()
sg.point_data.scalars.name = 'temperature'
sg.point_data.vectors = vectors
sg.point_data.vectors.name = 'velocity'

# Thats it!

# Now visualize the data.
d = mlab.pipeline.add_dataset(sg)
gx = mlab.pipeline.grid_plane(d)
gy = mlab.pipeline.grid_plane(d)
gy.grid_plane.axis = 'y'
gz = mlab.pipeline.grid_plane(d)
gz.grid_plane.axis = 'z'
iso = mlab.pipeline.iso_surface(d)
iso.contour.maximum_contour = 75.0
vec = mlab.pipeline.vectors(d)
vec.glyph.mask_input_points = True
vec.glyph.glyph.scale_factor = 1.5

mlab.show()