Datasets example
A Mayavi example to show the different data sets. See Data representation in Mayavi for a discussion.
The following images are created:
|
|
Python source code: datasets.py
# Author: Gael Varoquaux <gael dot varoquaux at normalesup.org>
# Copyright (c) 2008, Enthought, Inc.
# License: BSD style.
from numpy import array, random, linspace, pi, ravel, cos, sin, empty
from tvtk.api import tvtk
from mayavi.sources.vtk_data_source import VTKDataSource
from mayavi import mlab
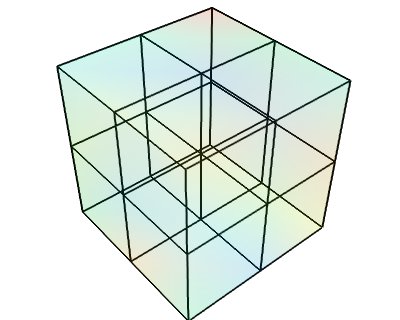
def image_data():
data = random.random((3, 3, 3))
i = tvtk.ImageData(spacing=(1, 1, 1), origin=(0, 0, 0))
i.point_data.scalars = data.ravel()
i.point_data.scalars.name = 'scalars'
i.dimensions = data.shape
return i
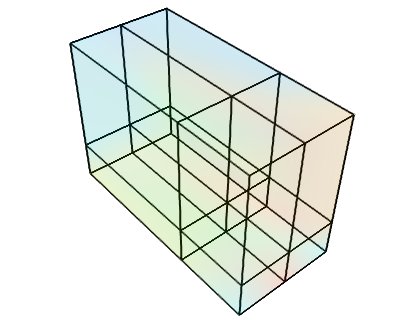
def rectilinear_grid():
data = random.random((3, 3, 3))
r = tvtk.RectilinearGrid()
r.point_data.scalars = data.ravel()
r.point_data.scalars.name = 'scalars'
r.dimensions = data.shape
r.x_coordinates = array((0, 0.7, 1.4))
r.y_coordinates = array((0, 1, 3))
r.z_coordinates = array((0, .5, 2))
return r
def generate_annulus(r, theta, z):
""" Generate points for structured grid for a cylindrical annular
volume. This method is useful for generating a unstructured
cylindrical mesh for VTK (and perhaps other tools).
"""
# Find the x values and y values for each plane.
x_plane = (cos(theta)*r[:,None]).ravel()
y_plane = (sin(theta)*r[:,None]).ravel()
# Allocate an array for all the points. We'll have len(x_plane)
# points on each plane, and we have a plane for each z value, so
# we need len(x_plane)*len(z) points.
points = empty([len(x_plane)*len(z),3])
# Loop through the points for each plane and fill them with the
# correct x,y,z values.
start = 0
for z_plane in z:
end = start+len(x_plane)
# slice out a plane of the output points and fill it
# with the x,y, and z values for this plane. The x,y
# values are the same for every plane. The z value
# is set to the current z
plane_points = points[start:end]
plane_points[:,0] = x_plane
plane_points[:,1] = y_plane
plane_points[:,2] = z_plane
start = end
return points
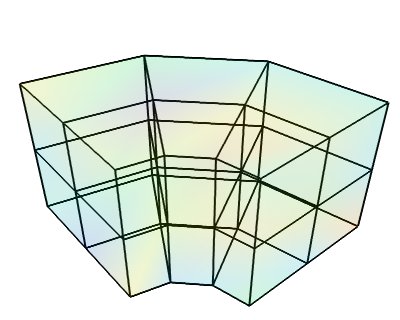
def structured_grid():
# Make the data.
dims = (3, 4, 3)
r = linspace(5, 15, dims[0])
theta = linspace(0, 0.5*pi, dims[1])
z = linspace(0, 10, dims[2])
pts = generate_annulus(r, theta, z)
sgrid = tvtk.StructuredGrid(dimensions=(dims[1], dims[0], dims[2]))
sgrid.points = pts
s = random.random((dims[0]*dims[1]*dims[2]))
sgrid.point_data.scalars = ravel(s.copy())
sgrid.point_data.scalars.name = 'scalars'
return sgrid
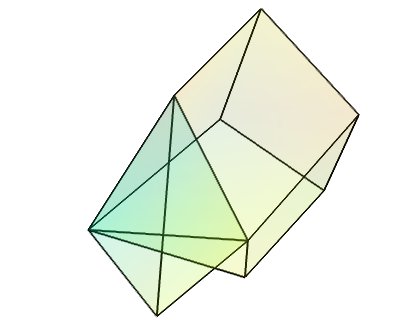
def unstructured_grid():
points = array([[0,1.2,0.6], [1,0,0], [0,1,0], [1,1,1], # tetra
[1,0,-0.5], [2,0,0], [2,1.5,0], [0,1,0],
[1,0,0], [1.5,-0.2,1], [1.6,1,1.5], [1,1,1], # Hex
], 'f')
# The cells
cells = array([4, 0, 1, 2, 3, # tetra
8, 4, 5, 6, 7, 8, 9, 10, 11 # hex
])
# The offsets for the cells, i.e. the indices where the cells
# start.
offset = array([0, 5])
tetra_type = tvtk.Tetra().cell_type # VTK_TETRA == 10
hex_type = tvtk.Hexahedron().cell_type # VTK_HEXAHEDRON == 12
cell_types = array([tetra_type, hex_type])
# Create the array of cells unambiguously.
cell_array = tvtk.CellArray()
cell_array.set_cells(2, cells)
# Now create the UG.
ug = tvtk.UnstructuredGrid(points=points)
# Now just set the cell types and reuse the ug locations and cells.
ug.set_cells(cell_types, offset, cell_array)
scalars = random.random(points.shape[0])
ug.point_data.scalars = scalars
ug.point_data.scalars.name = 'scalars'
return ug
def polydata():
# The numpy array data.
points = array([[0,-0.5,0], [1.5,0,0], [0,1,0], [0,0,0.5],
[-1,-1.5,0.1], [0,-1, 0.5], [-1, -0.5, 0],
[1,0.8,0]], 'f')
triangles = array([[0,1,3], [1,2,3], [1,0,5],
[2,3,4], [3,0,4], [0,5,4], [2, 4, 6],
[2, 1, 7]])
scalars = random.random(points.shape)
# The TVTK dataset.
mesh = tvtk.PolyData(points=points, polys=triangles)
mesh.point_data.scalars = scalars
mesh.point_data.scalars.name = 'scalars'
return mesh
def view(dataset):
""" Open up a mayavi scene and display the dataset in it.
"""
fig = mlab.figure(bgcolor=(1, 1, 1), fgcolor=(0, 0, 0),
figure=dataset.class_name[3:])
surf = mlab.pipeline.surface(dataset, opacity=0.1)
mlab.pipeline.surface(mlab.pipeline.extract_edges(surf),
color=(0, 0, 0), )
@mlab.show
def main():
view(image_data())
view(rectilinear_grid())
view(structured_grid())
view(unstructured_grid())
view(polydata())
if __name__ == '__main__':
main()