カスタムカラーマップの例
特定のオブジェクトでカスタムカラーマップ(またはテーブルを参照)を使用する方法を示す例.
エンドユーザは定義済みのカラーマップのセット名を指定してカラーマップを指定しますが,Mayavi(およびVTK)は 'Look Up Tables' (LUT) を使用して内部的にカラーを処理します.これは,スカラー値をRGBAコンポーネントによって定義されるカラーに関連付けるテーブルです.
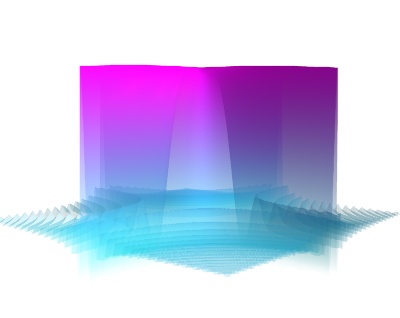
この例では,オブジェクトのLUTを取得および変更する方法を示します.具体的には,サーフオブジェクトに 'cool' カラーマップを指定することから始めますが,addを変更して透明度効果を追加します.
作成されたイメージで,サーフェスの下部ポイントがより透明になることに注目してください.
別の数のカラーを使用する場合は,lutオブジェクトの 'number_of_colors' アトリビュートを変更し,適切なシェイプの新しい配列をその 'table' アトリビュートに割り当てることができます.
Pythonソースコード: custom_colormap.py
# Create some data
import numpy as np

x, y = np.mgrid[-10:10:200j, -10:10:200j]
z = 100 * np.sin(x * y) / (x * y)

# Visualize it with mlab.surf
from mayavi import mlab
mlab.figure(bgcolor=(1, 1, 1))
surf = mlab.surf(z, colormap='cool')

# Retrieve the LUT of the surf object.
lut = surf.module_manager.scalar_lut_manager.lut.table.to_array()

# The lut is a 255x4 array, with the columns representing RGBA
# (red, green, blue, alpha) coded with integers going from 0 to 255.

# We modify the alpha channel to add a transparency gradient
lut[:, -1] = np.linspace(0, 255, 256)
# and finally we put this LUT back in the surface object. We could have
# added any 255*4 array rather than modifying an existing LUT.
surf.module_manager.scalar_lut_manager.lut.table = lut

# We need to force update of the figure now that we have changed the LUT.
mlab.draw()
mlab.view(40, 85)

mlab.show()